The A/B-testing workspace I built for my team.
ABLab turns a VWO export into a Bayesian verdict, then saves the result as something the team can find and reuse.
One result meant three tools.
Visitor counts, coach IDs and conversions lived in different places. I stitched them together in a spreadsheet, then shared a screenshot.
Hard to read
A spreadsheet screenshot did not tell a key account manager what to implement or why.
- No history in one place
- Numbers without a decision
Slow to repeat
The same export work returned every week, across designers and markets.
- Too many tabs
- Tracking depended on memory
Easy to forget
Answering "have we tried this in Finland?" meant digging through old files.
- No shared taxonomy
- Results lost their hypothesis
From export to verdict in minutes.
It works with the exports our pages already produce. No script to install.
Create
Name the coach and test, choose a hypothesis, then tag the markets and design changes.
social proof · NO · DK · SE · FI
Upload
Drop the CSV, add visitor counts and generate the dashboard. New exports become weekly snapshots.
Data → Experiment ID, State
2514-a, 1 · 2514-b, 5 … 12,163 rows
Decide
Review three funnel stages. At 90%, finalize the verdict and save the learning to the Results Library.
Two columns are enough. -a is control, -b is variant, state 5 is a won client.
The numbers lead to a verdict.
ABLab runs 60,000 Monte Carlo draws per funnel stage. It calls a verdict at 90%.
A probability I can explain.
For each stage, ABLab draws control and variant samples from Beta distributions and counts how often the variant wins. The result stays separate for each stage.
- No separate sample-size calculator
- Nudges start at 85%, a verdict lands at 90%
- Every stage scored on its own
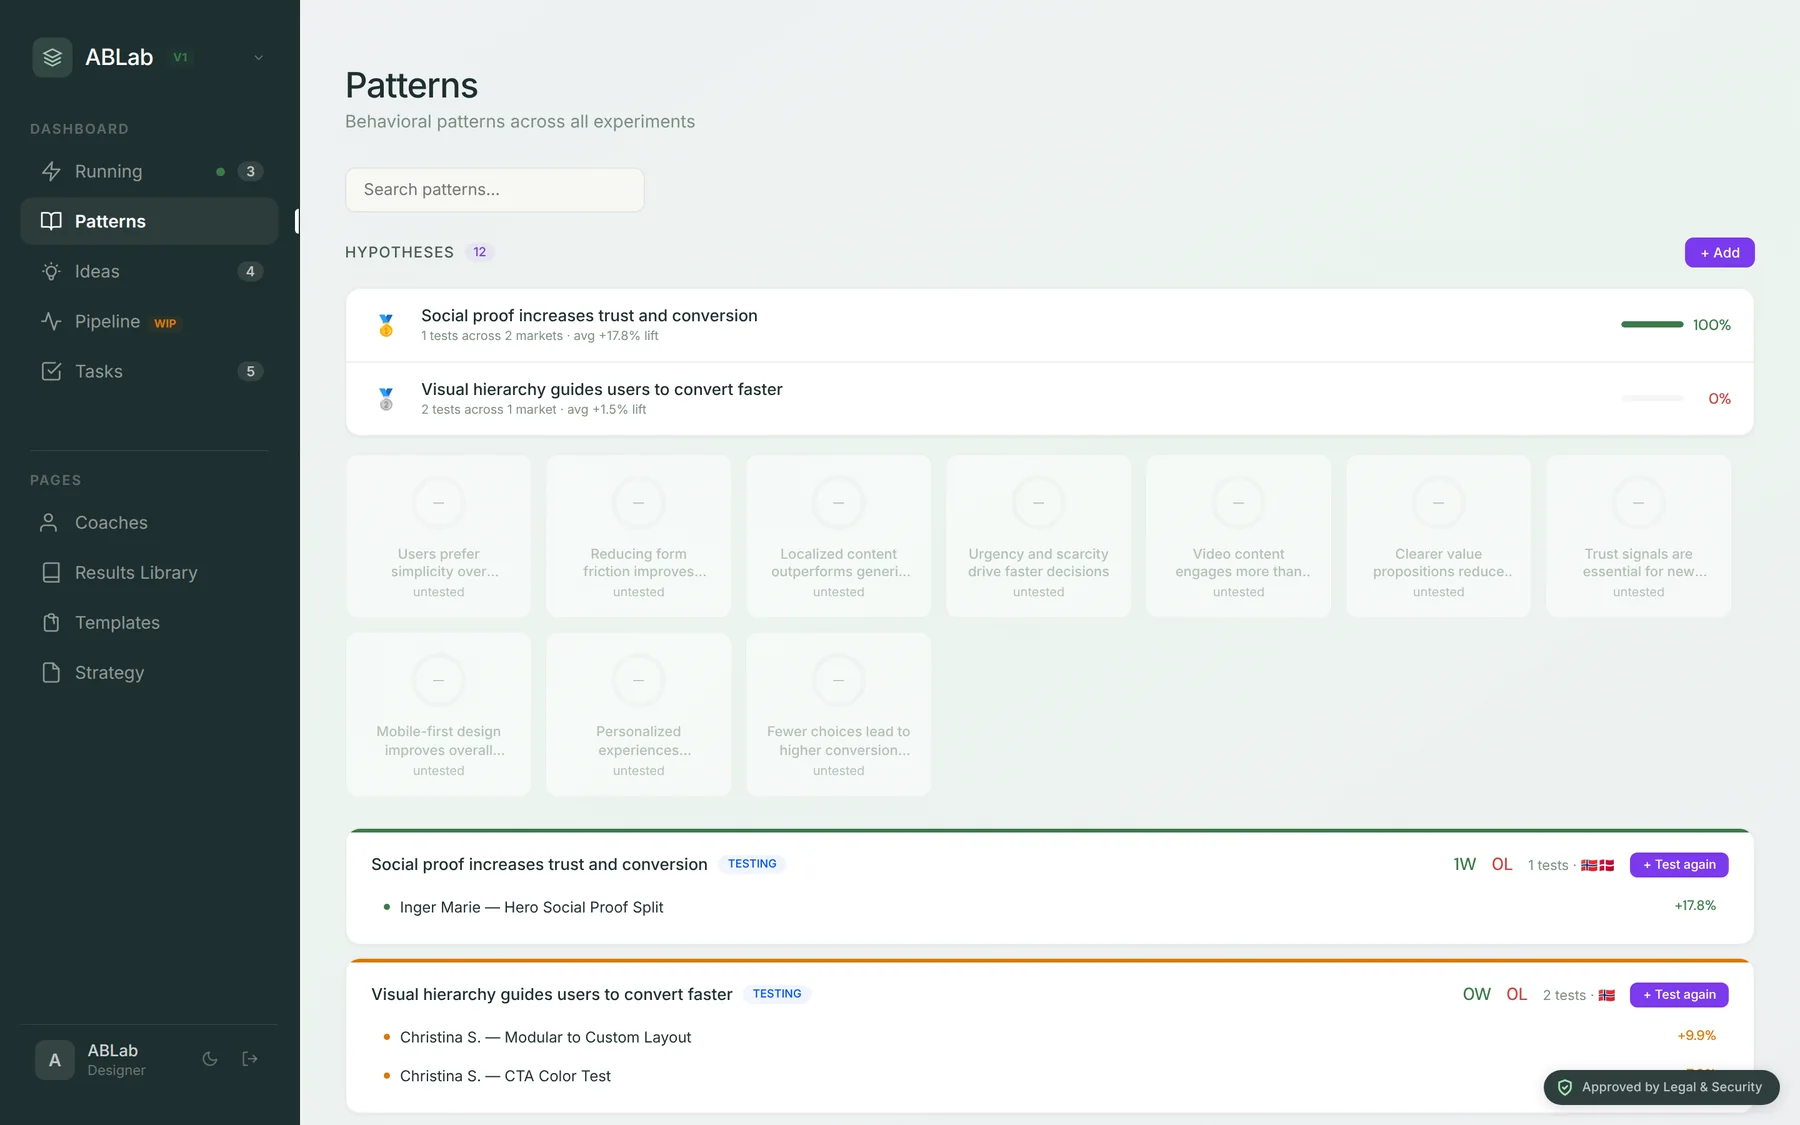
The hypothesis stays attached.
Every test records the belief behind it. Finished results build a history of wins, losses and inconclusive calls.
- Twelve behavioural hypotheses out of the box, plus your own
- One searchable history of what held up
Three stages, one funnel.
Visitor to lead, lead to client and visitor to client stay separate. A sign-up win that hurts close rate cannot hide inside an average.
- Sign-up, win and overall rate reported separately
- Trade-offs visible on the first screen
Alerts that read the numbers.
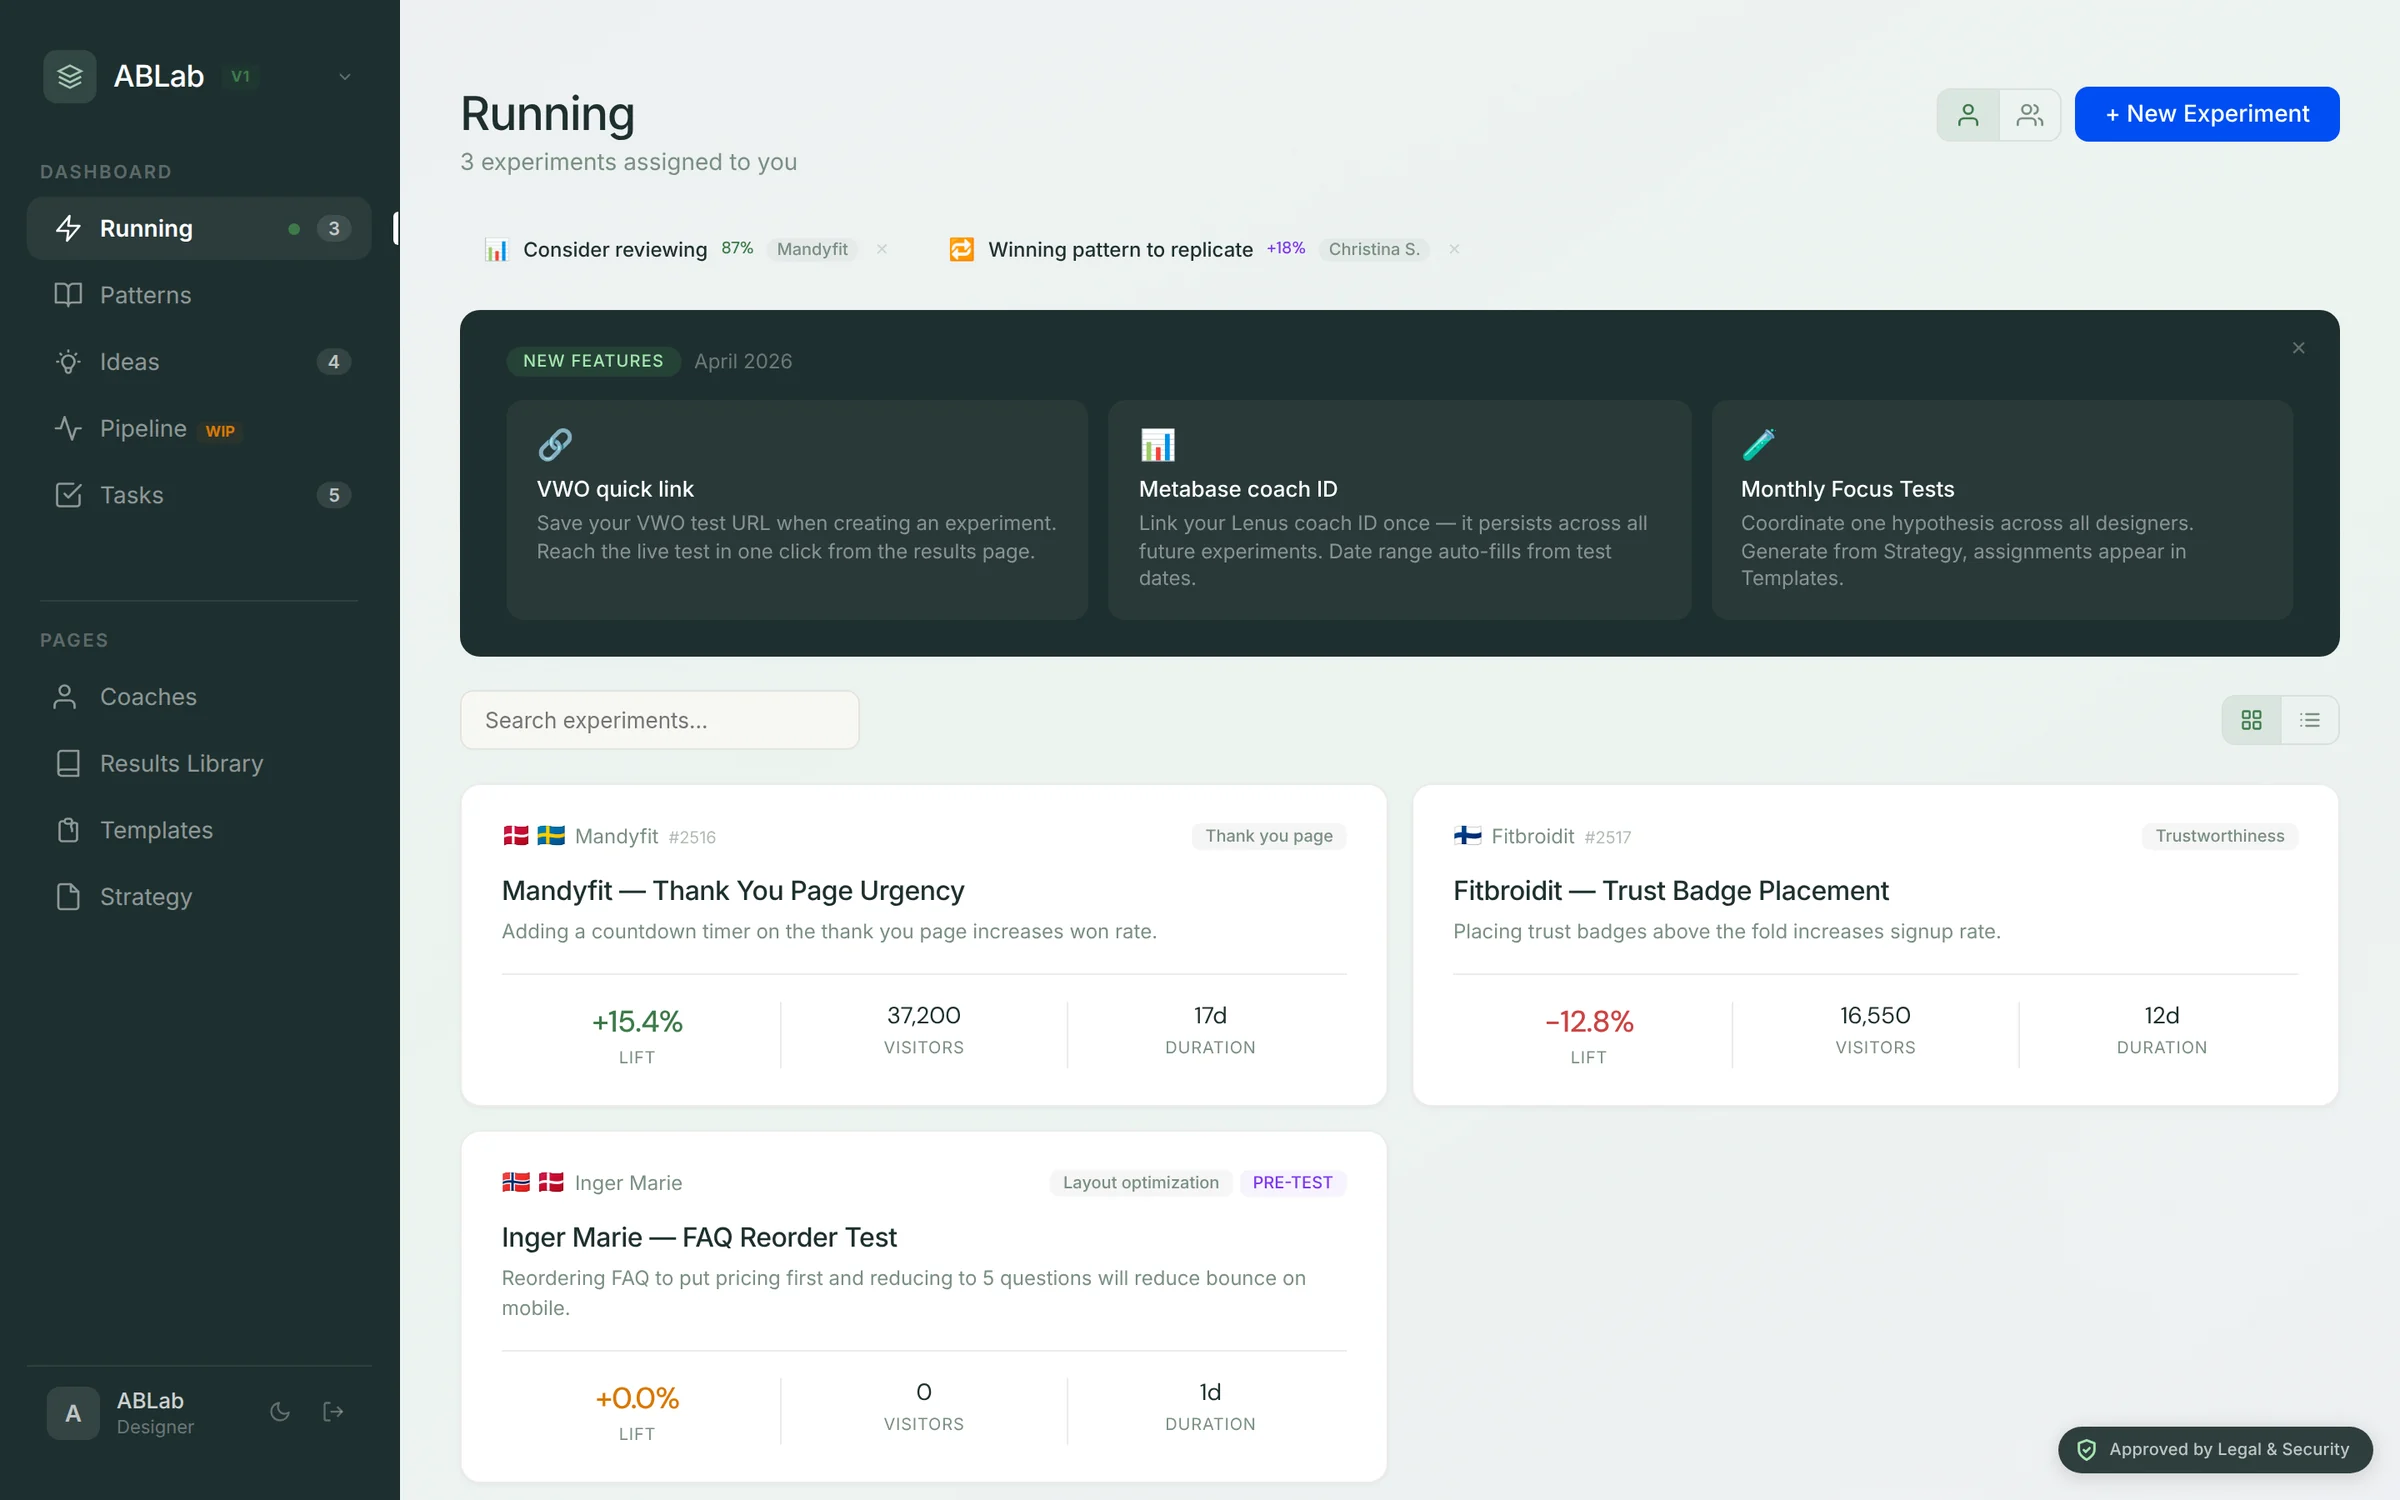
The Running tab flags tests ready to finalize, falling variants and patterns worth trying elsewhere.
- Consider reviewing · Mandyfit · 87%
- Winning pattern to replicate · Christina S. · +18%
- Missing learnings · CTA Color Test

A verdict people can use.
The built-in strategist explains the numbers in plain language and suggests three next tests. A key account manager can forward the conclusion as written.
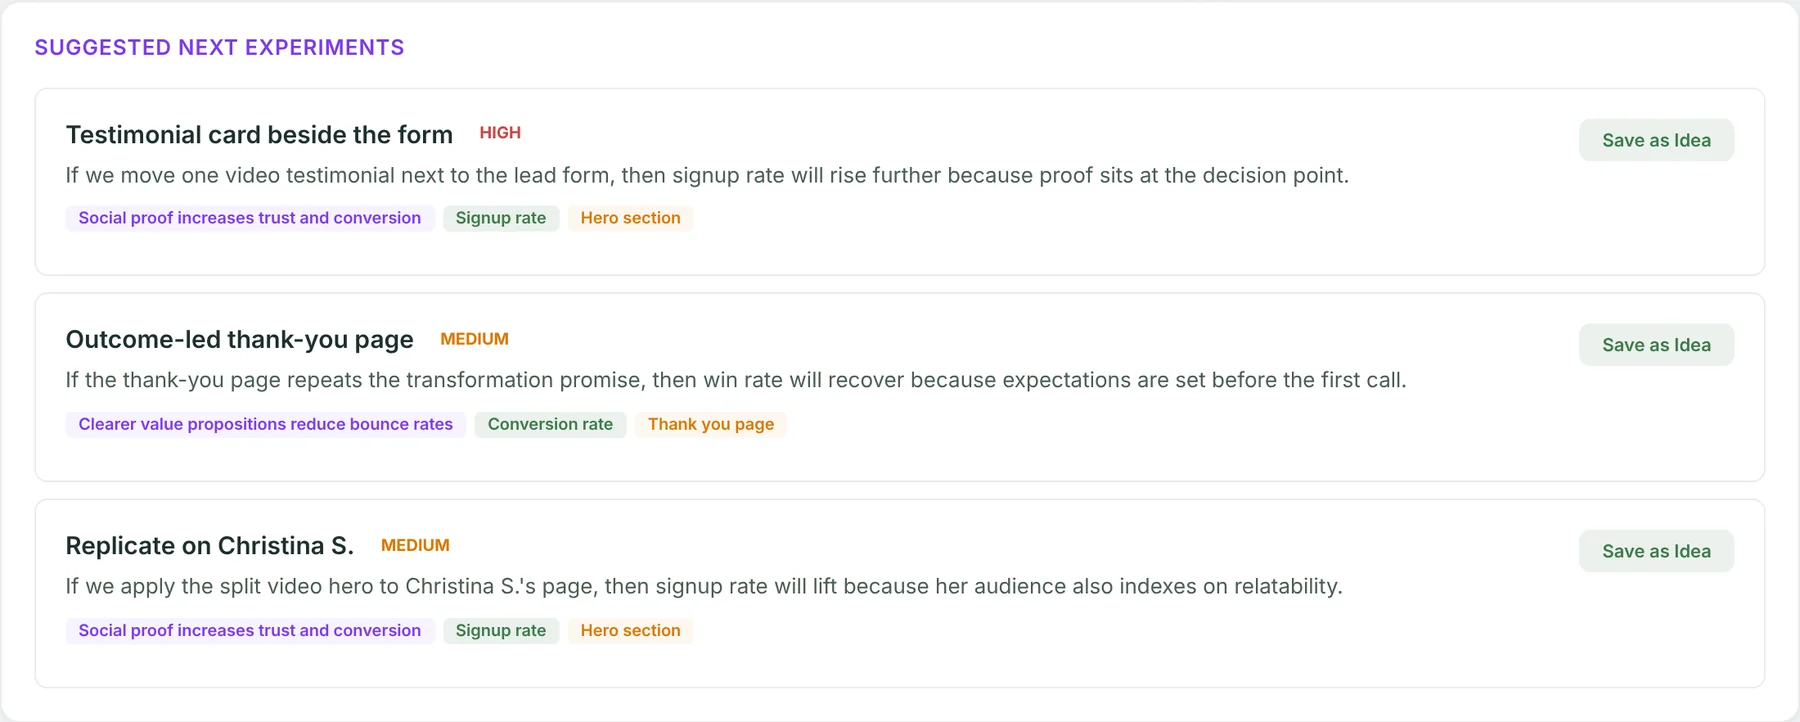
A suggestion can become a pre-filled test in one click.
A quick tour of the product.
The real product, from hypotheses to finished results.
Patterns
Hypotheses, win rates and every related test.
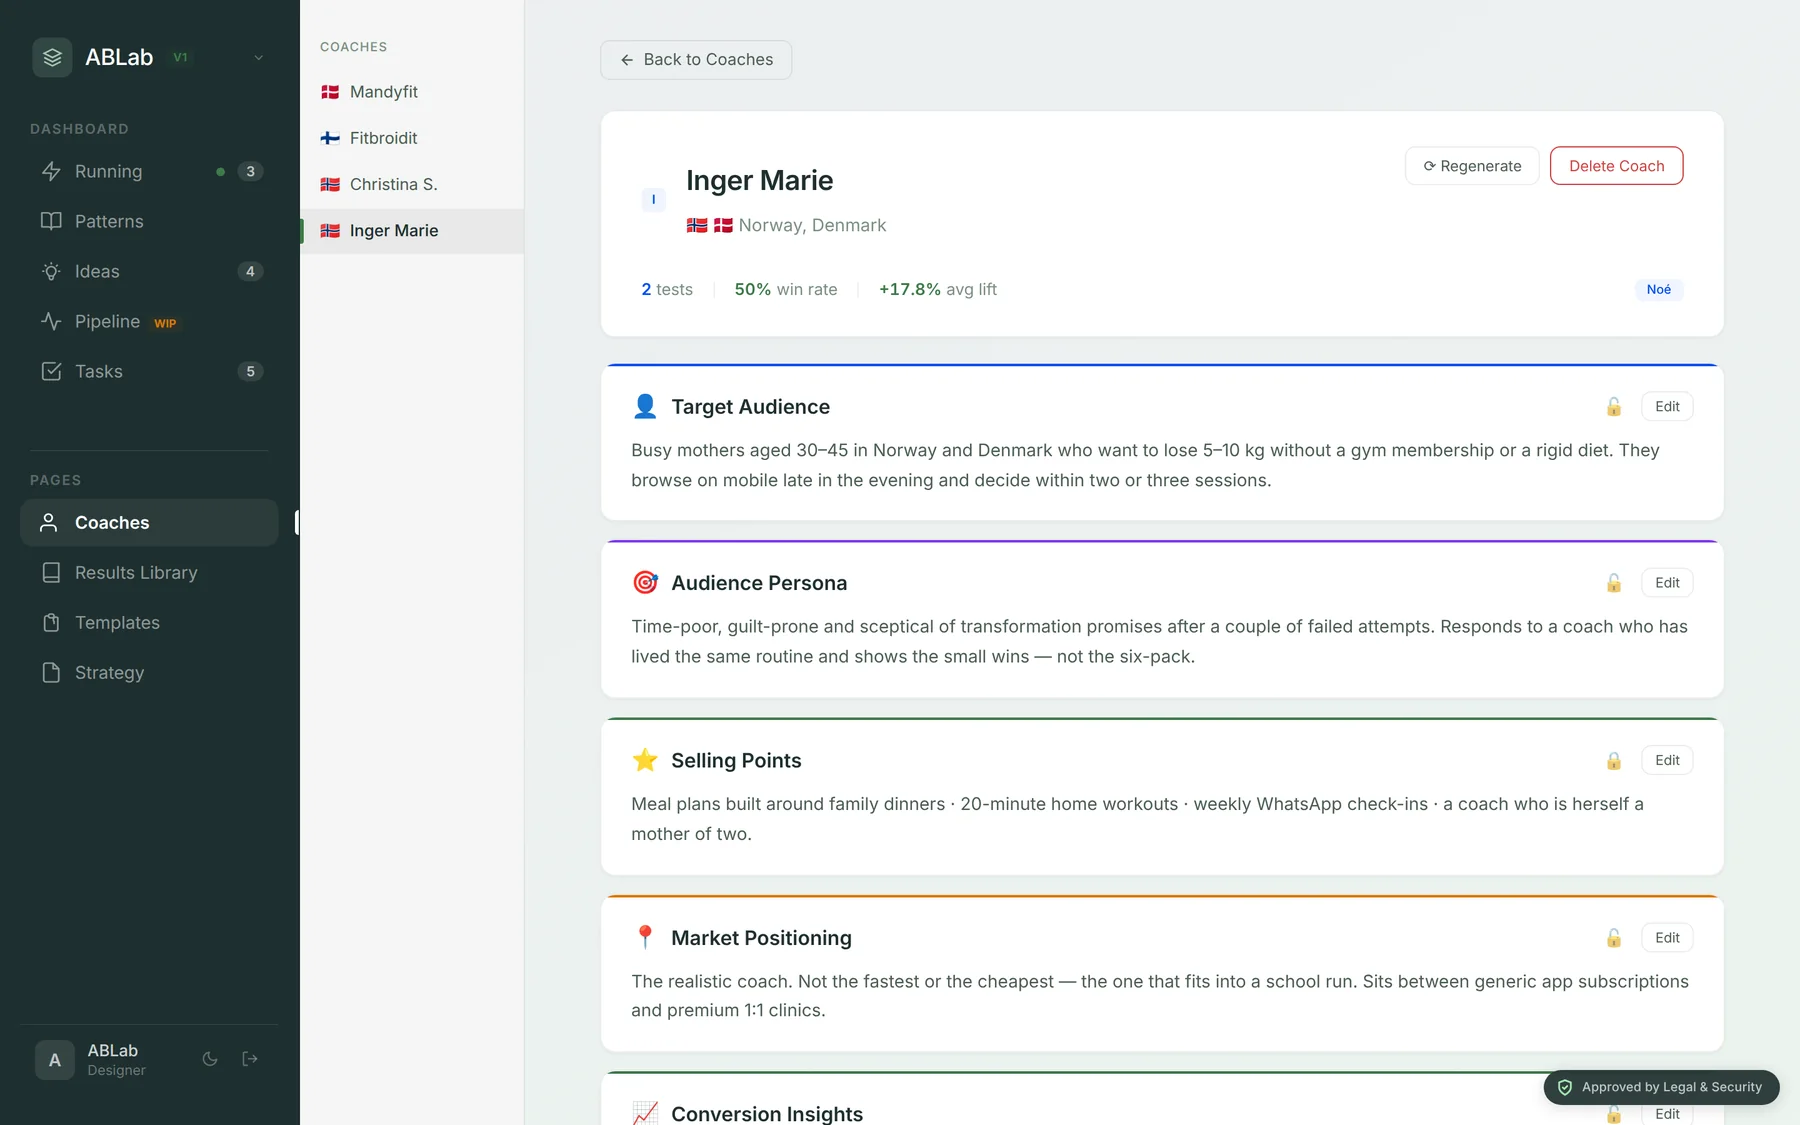
Coach intelligence
Audience, positioning, similar coaches and root causes.
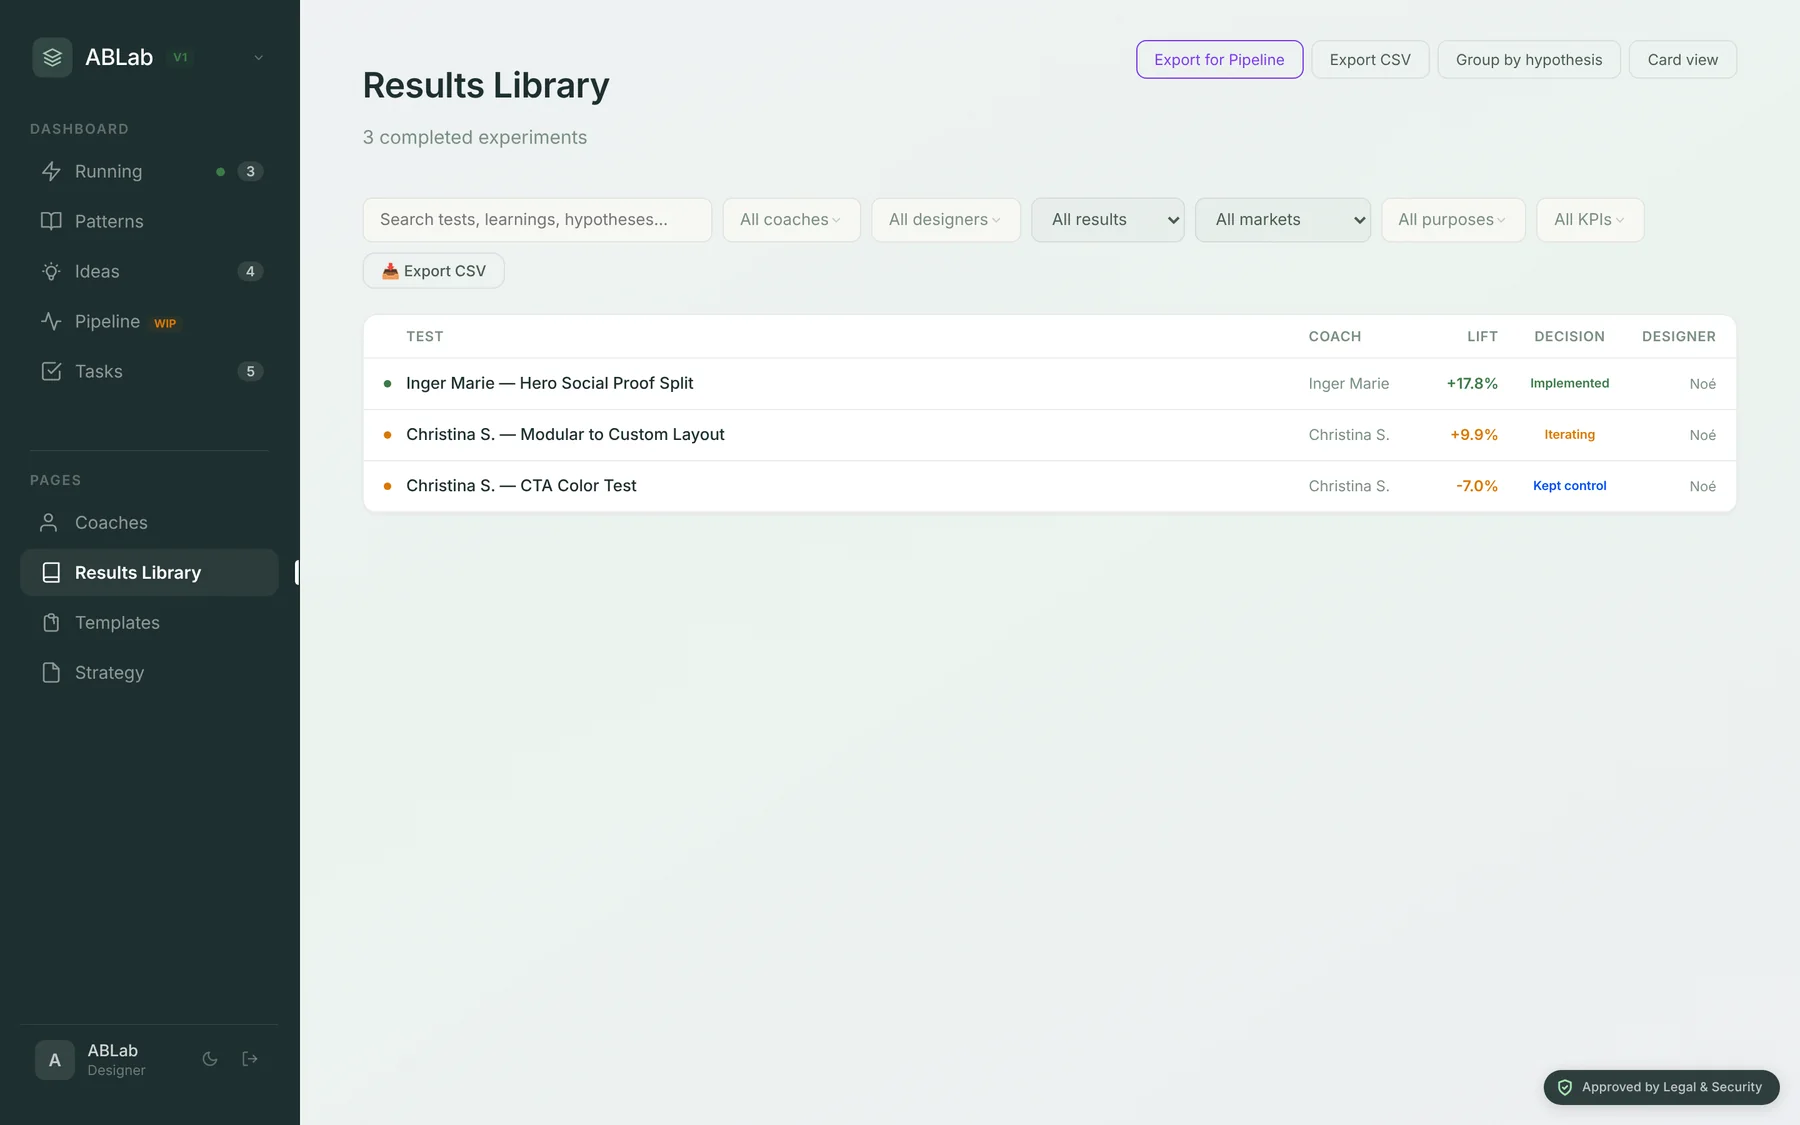
Results Library
Finished tests, learnings and decisions in one place.
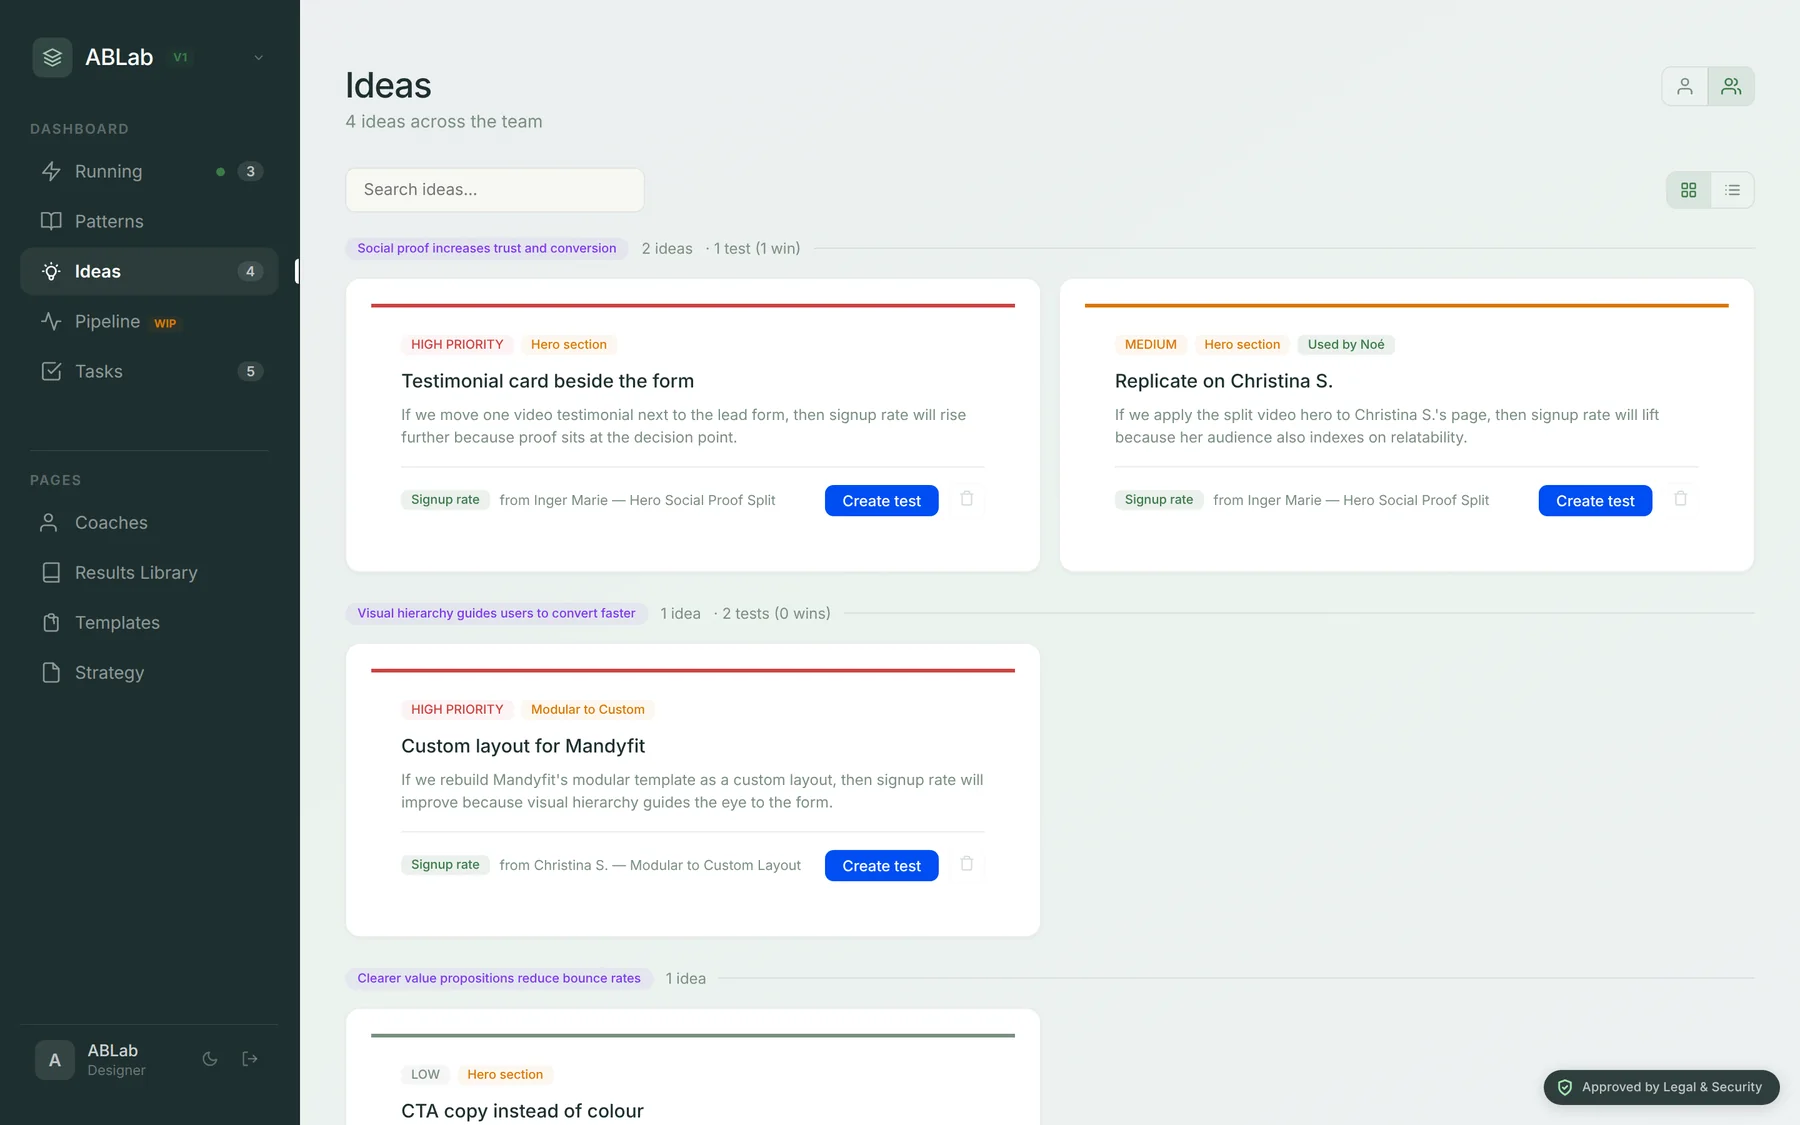
Ideas
Saved suggestions grouped by hypothesis and reuse.
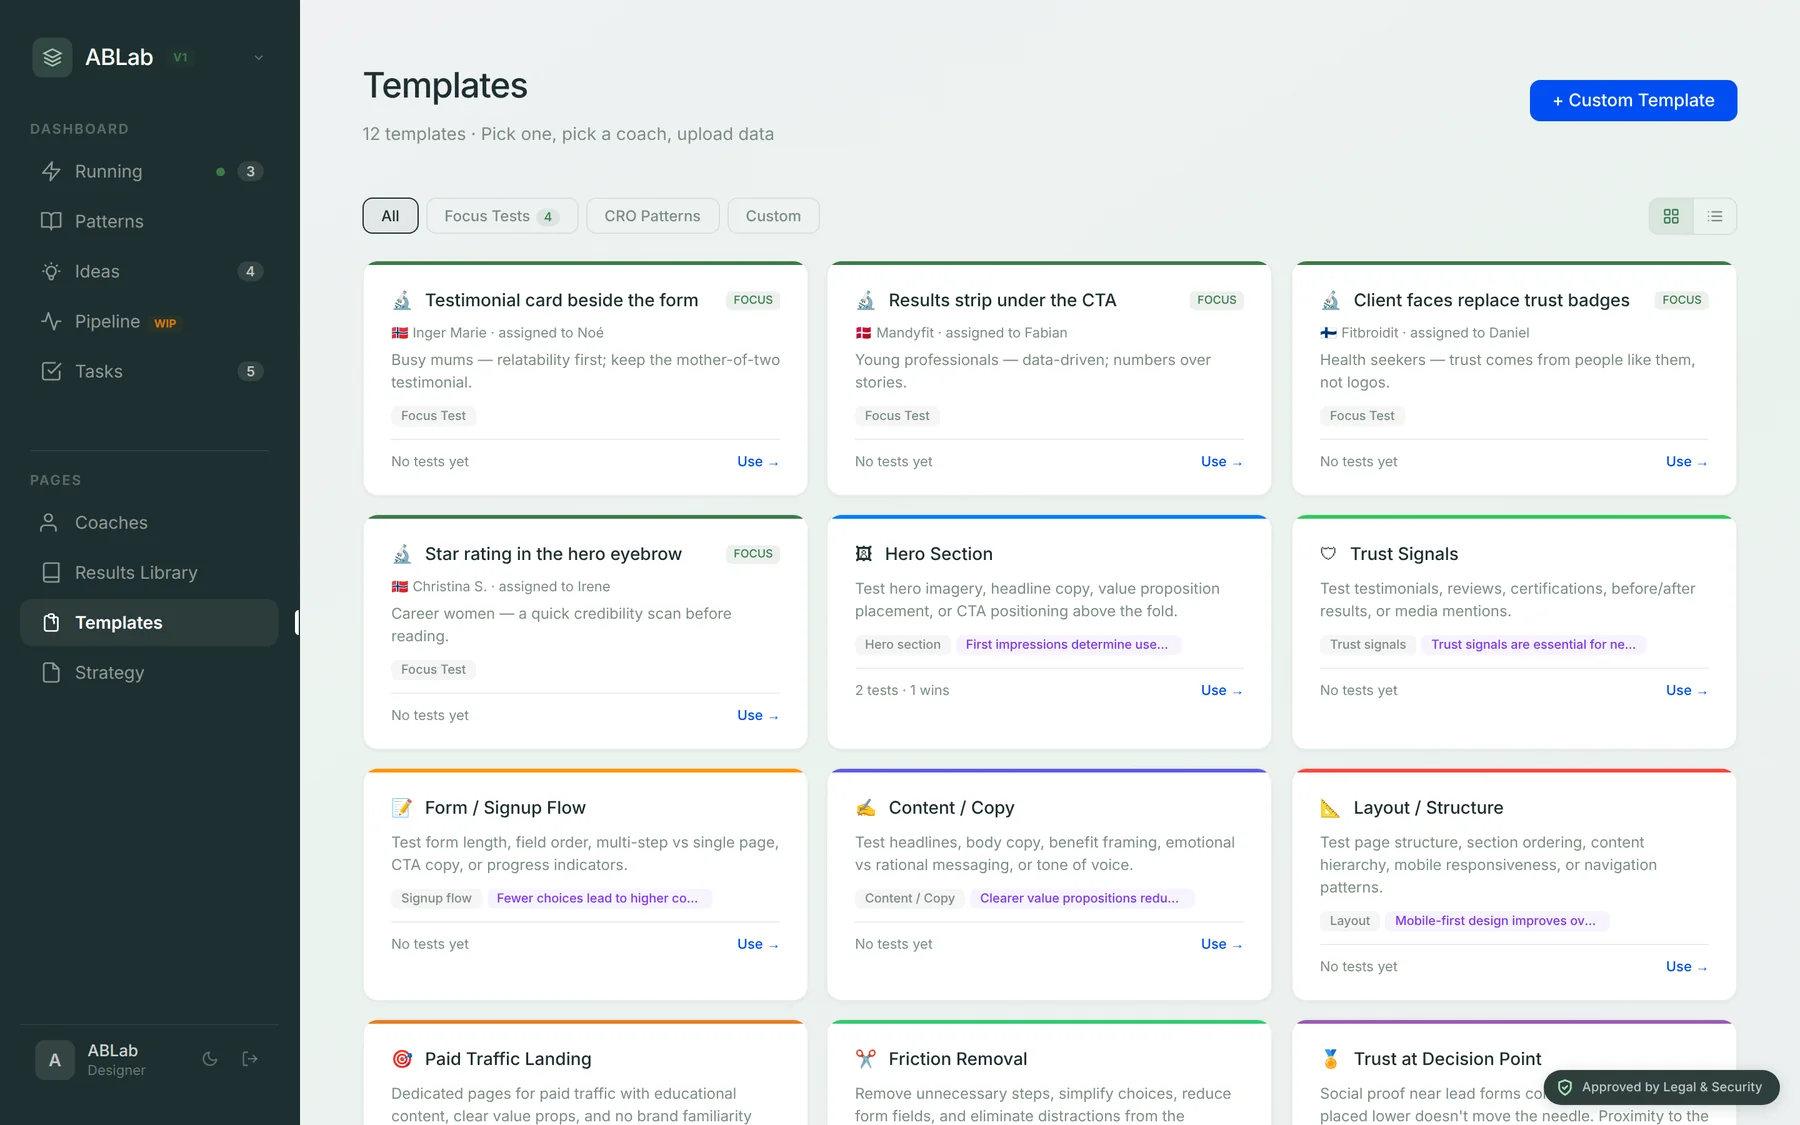
Templates
Reusable CRO patterns and the month's Focus Test.
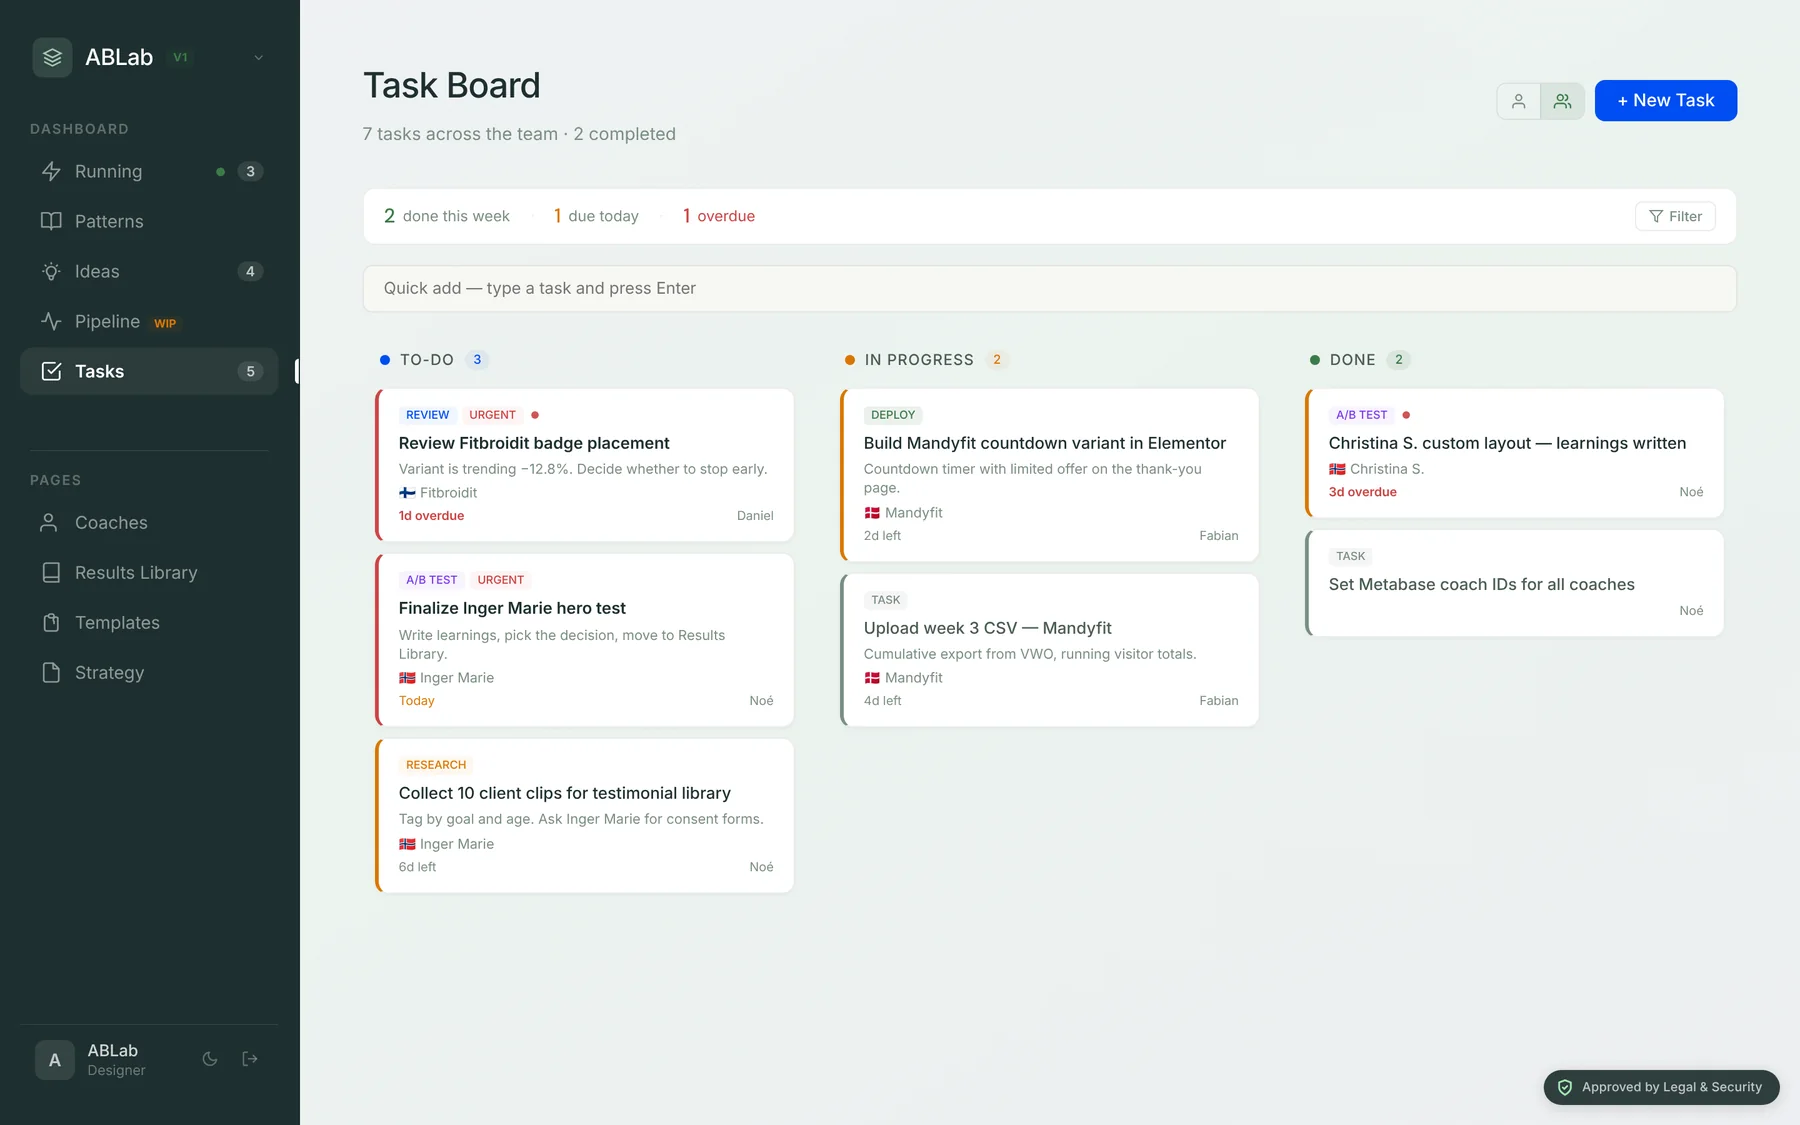
Task board
Tasks by status, urgency, deadline and coach.
I built it alone.
The team kept using it.
There was no budget or engineering team. It caught on because it made a weekly job easier.
tests run across four Nordic markets.
designers using it in daily practice, with one shared language for hypotheses.
person to design, build and ship it, with Claude as the development environment.
One result became its own case study: a food-first redesign tested across 14,304 visitors. The variant produced 11 clients from 72 leads, against 6 from 89. ABLab made that funnel trade-off visible.
Read that experimentIt fits the tools we already use.
No migration: existing exports in, existing accounts for sign-in.
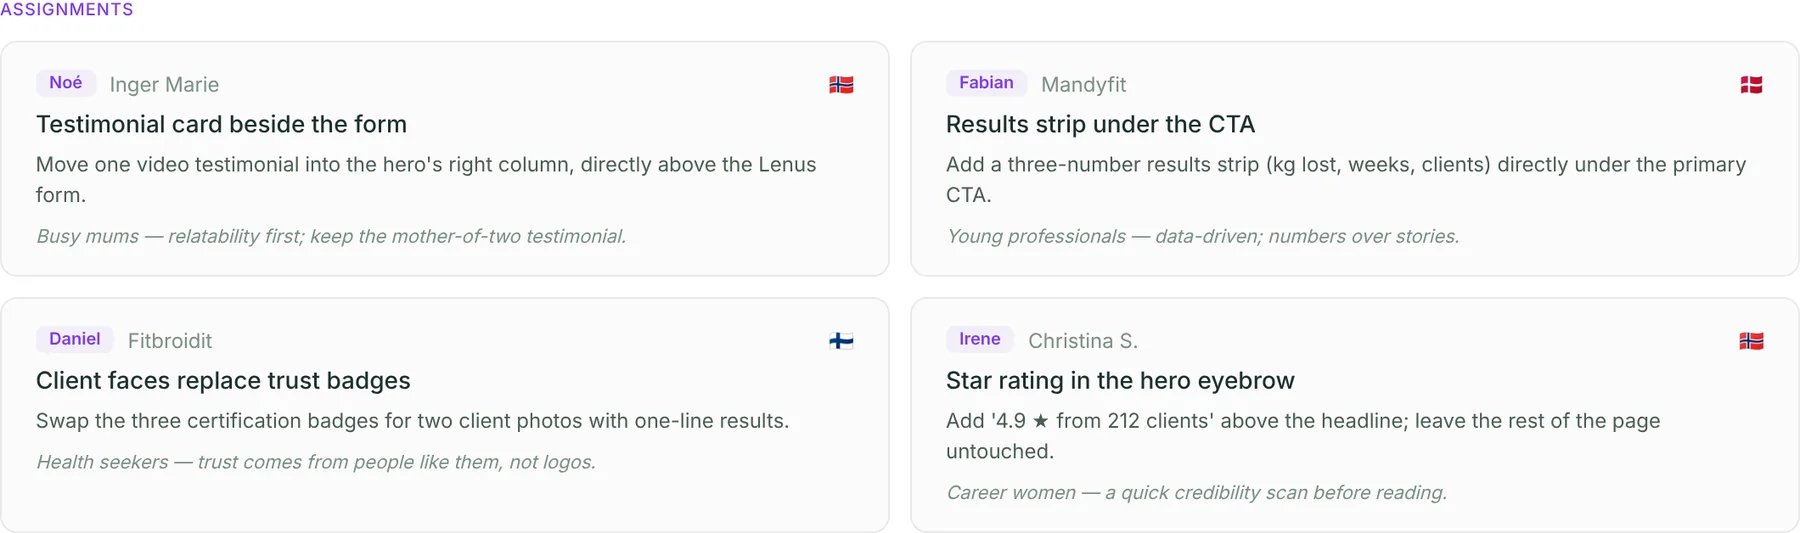
One shared focus each month.
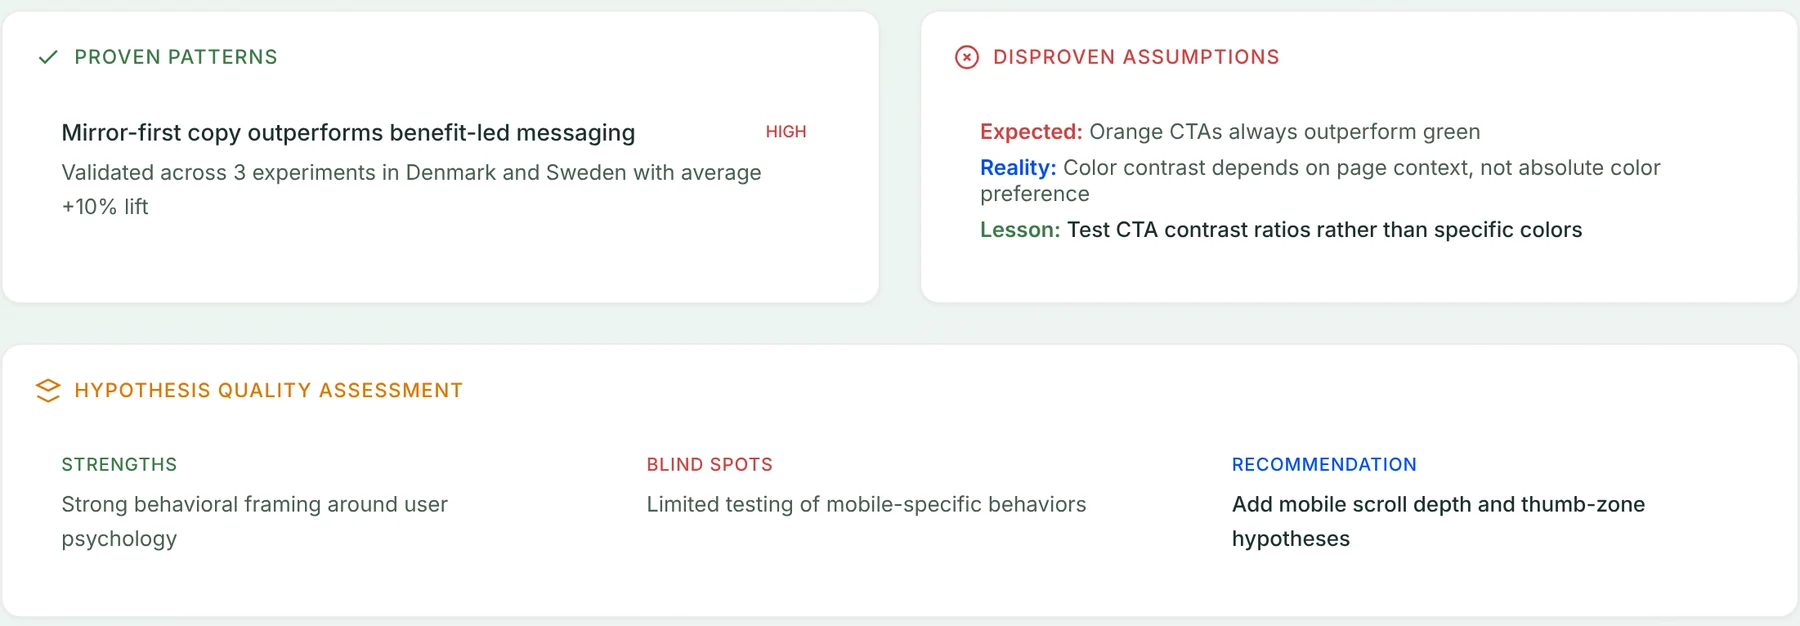
Strategy reviews finished tests, summarizes what held up and assigns one hypothesis across designers, coaches and markets.
Proven patterns
Repeatable wins, with the tests behind them.
Disproven assumptions
What we expected, what happened and what we learned.
Market insights
How Norway, Denmark, Sweden and Finland respond differently.
Focus Test
One coordinated assignment per designer and coach.